Automated scenario comparison
PyDSS enables users to automatically generate high quality plots using the exported simulation resuts. Users both both generate plots for an induvisual scenario or generate plots to compare multiple scenarios. It is important to note that to run to generate these plot users need to define a visualization toml file ‘Generate_visuals’ should be set to true to enable the feature. Additionally any plot the user requires should also be set to true. A example has been provided on how to setup the comparison feature and can found at ~\PyDSS\examples\Custom_controls_example\Scenarios. ‘automated_comparison.toml’ file contains contains the visualization settings
[Simulations]
        Run_simulations = true
        Generate_visuals = false
        Run_bokeh_server = false
[Plots]
        Frequency_sweep = false
        XFMR_tap = true
        Voltage_sag = false
        Voltage = false
        Loading = false
        Voltage_Loading = false
        Voltage_profiles = false
        Load = false
        Generation = false
        Load_Generation = false
        Curtailment = false
        Voltage_imbalance = false
        Feeder_power = false
        Feeder_line_losses = false
        Feeder_losses = false
        Feeder_substation_losses = false
[Visualization]
        Plotting_mode ="Separate"
        FileType = 'png'
Simulations.Run_simulations [bool] - If ‘false’, the simulatiosn will not run the simulation or not.
Simulations.Generate_visuals [bool] - If ‘false’, plots will not be generated. Will generate plots if set to ‘true’, even is ‘Run_simulations’ is set to false using results exported from previos simulations. If files required are not available, an assertion error will be raised.
Plots [dict] - Within the plots dicionary, all plots user required to be generated can be set to ‘true’. If files required are not available, an assertion error will be raised.
Visualization.Plotting_mode [string] - Possible values are [‘Single’, ‘Separate’]. Allows user to either generate seperate plots or comparative plots.
Visualization.FileType [string] - Possible values are [‘png’, ‘pdf’]. Allows user export plots in multiple formats.
Once the visualization file has been correclty configured, the simulations canbe run using the following code.
import click
import sys
import os

@click.command()
@click.option('--pydss_path',
                          default=r'C:\Users\alatif\Desktop\PyDSS')
@click.option('--sim_path',
                          default=r'C:\Users\alatif\Desktop\PyDSS\examples\External_interfacing_example\pyDSS_project\Scenarios')

def run_pyDSS(pydss_path, sim_path):
        sys.path.append(pydss_path)
        sys.path.append(os.path.join(pydss_path, 'PyDSS'))
        from pyDSS import instance as dssInstance
        a = dssInstance() # Create an instance of PyDSS
        # the run command takes in list of scenrio TOML files and visualization TOML file as function inputs
        a.run(['~\\PyDSS\\examples\\Custom_controls_example\\Scenarios\\base_case.toml',
                '~\\PyDSS\examples\\Custom_controls_example\\Scenarios\\self_consumption.toml',
                '~\\PyDSS\\examples\\Custom_controls_example\\Scenarios\\volt_var.toml',
                '~\\PyDSS\examples\\Custom_controls_example\\Scenarios\\multiple_controllers.toml'],
        '~\\PyDSS\\examples\\Custom_controls_example\\Scenarios\\automated_comparison.toml'
        ) #Run the simulation

run_pyDSS()
Loading vs Voltage KDE plot for all transformer (for a QSTS simulation)
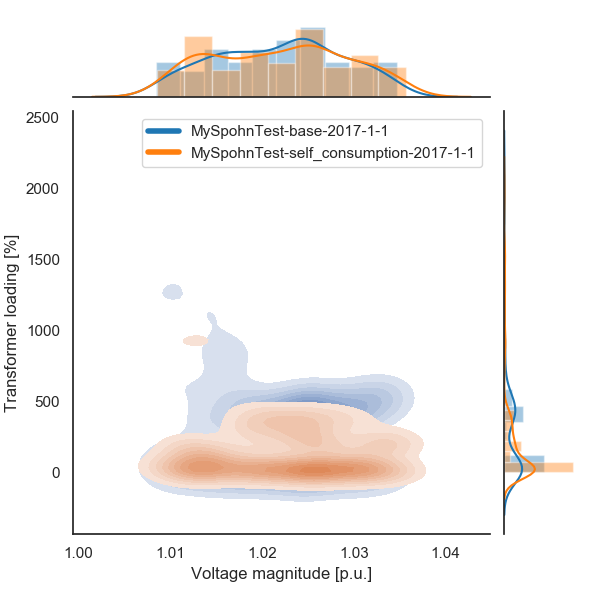
User have also been provided the option to change plot settiings using the same TOML file. As an example dictionaty for the plot above is shown below. To generate the plot, ‘Generate_visuals’ was set to ture and ‘Plotting_mode’ was set to ‘Single’.
[Visualization.Voltage_Loading_settings]
        Height = 7
        DPI = 200
        Display_limits = true
        Alpha = 0.05
        Legend_font_size = 10
        Frequency = 60.0
        Simulation_mode = "Yearly"
        Grid = true
        # kind - str - possible options 'scatter', 'reg', 'resid', 'kde', 'hex'
        Kind = "kde"
        # Class - str - possible options 'Lines', 'Transformers'
        Class = "Transformers"
The plot shows the impact of running storage in self consumption on voltage at the PCC.
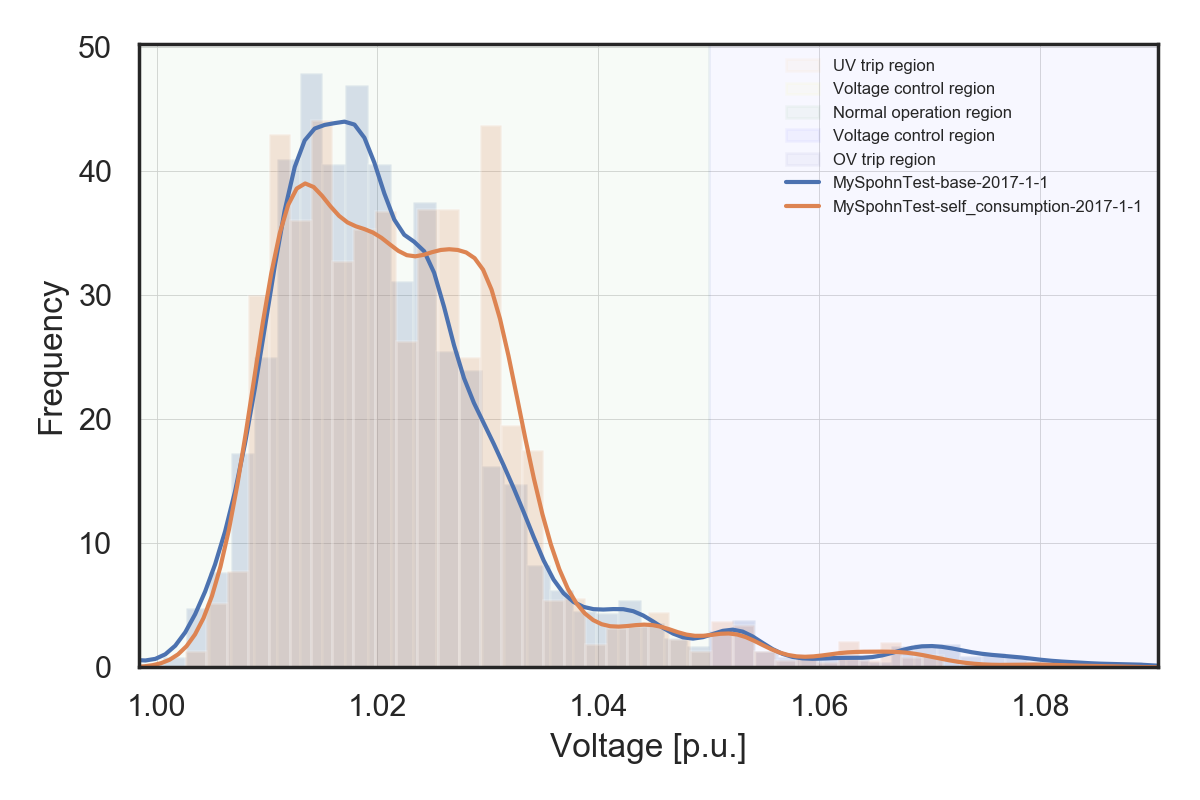
The plots hilghts various voltage regions. Users are able to change the defaults settings using the TOML file.
[Visualization.Voltage_settings]
        Height = 4
        Width = 6
        DPI = 200
        Grid = true
        Line_width = 3
        Line_alpha = 0.2
        Fill_alpha = 0.2
        Frequency = 60.0
        Legend_font_size = 6
        Simulation_mode = "Yearly"
        Color_template = "Blues"
        Show_operation_regions = true
        Y_ranges = [0.0, 0.90, 0.95, 1.05, 1.10, 1.5]
        Y_range_labels = ["UV trip region", "UV Voltage control region", "Normal operation region", "OV Voltage control region", "OV trip region"]
        Y_range_colors = ["orange", "yellow", "green", "blue", "darkblue"]